Evelyn Bruneau, The University of Manitoba
Overview
When content is available from more than one source, we refer to this as “overlap.” Examples of this include when e-journal and e-book titles are available in more than one database; when titles indexed are found in two or more Abstracting & Indexing (A&I) databases; or when online holdings, such as the purchase of journal backfiles, duplicate print or other library holdings.
The most common types of overlap analysis are:
- Comparing the overlap of titles and coverage dates between or among full text and/or aggregator collections or databases.
- Comparing the overlap of titles and coverage dates between or among A&I databases
- Comparing the overlap of titles and coverage dates of an A&I database to full text access
- Comparing the overlap of titles and coverage dates to print and/or physical holdings
- Comparing your institution’s holdings with those of peer institutions
- Comparing your institution’s holdings with consortium offers
Why Conduct an Overlap Analysis?
Overlap analyses can help clarify the uniqueness of, and similarities between, two or more databases or collections, and the extent of overlap between resources. Knowing the overlap between collections can help you to make informed collections decisions, including whether to acquire, renew, drop or change access level (ex. Change from full text version to A&I) for a resource or collection.
The results of an overlap analysis can also help to decrease the duplication between physical (print, microforms, etc.) and online holdings and identify titles that your library may want to cancel, weed, or, conversely, want to purchase from a particular provider. An analysis identifies print materials that can be weeded and replaced due to ownership of online backfiles or one time purchases of archival materials, or based on perpetual/post-cancellation access entitlements, thereby enabling a library to free up and repurpose valuable floor space.
Overlap analysis can also be used for collaborative collection development; it can be used to determine overlap among libraries.
You could also conduct an overlap analysis when considering a special offer from a publisher; or when budget cuts compel you to review the library’s existing holdings for potential savings.
Note: The results of an overlap analysis are not to be used as a single method for determining whether or not to acquire or cancel a particular resource. For example, citations, journal usage, user ratings, programmatic coverage, cost effectiveness (cost-per-use), and uniqueness of content must also be considered.
Things to Consider When Conducting an Overlap Analysis
- Perpetual vs. leased access to content
- Access via aggregator vs “stable” publisher collection
- Aggregators
- Turnover of titles
- Lack of access to current content due to moving walls/embargoes
- Aggregators
- Amount of freely available and Open Access content
- Depth of indexing
- Years of coverage. Your analysis must take years of coverage into consideration as different points of access my provide varying years of coverage
- Which titles are unique?
- What do we retain if we stop subscribing?
- What would be the impact of not having the resource?
- Overlap analysis does not take into consideration the quality of metadata, ex. Controlled vocabulary subject terms (Belvadi, 2015)
Overlap Tools/What you will use
- Electronic Resource Management Systems (ERMS)
- Serials Solutions
- Alma: Overlap and Collection Analysis Tool, or Alma Analytics
- FOLIO
- OCLC WorldShare Management Service
- Gold Rush Decision Support (formerly Gold Rush® Reports) allows libraries to do content overlap between electronic resource packages from primary publishers, aggregators and indexing/abstracting services. Users can compare one-to-one or many-to-many in the same simple interface (Features of Gold Rush)
- Excel or similar spreadsheet program (to analyze data)
- Title list (KBART or publisher list)
- Export of electronic journal, electronic book, physical holdings from the library catalogue or an analytics or similar report exported from your ERMS.
Metadata Required/Column Headings*
- Title
- pISSN, eISSN (eISBN, pISBN)–used as match point
- Year of Publication
- Edition
Suggestions for Additional Column Headings*
- Overlap (Y/N)
- Overlap (Full or Partial)
- Overlap Package(s)
- Physical Holdings (Y/N)
- Physical Location
- Format
- Access Owned or Leased
- Years of full text coverage or depth of indexing (start and end dates)
- Embargo (months and/or years)
*varies by type of material.
The Basics
You will conduct your overlap analysis using either a vendor provided tool or by hand. You will use one list as your master document where you will import and compare data using a variety of formulas.
Identify any overlaps that occur with your holdings and populate the appropriate columns.
Methodology (Belvadi, 2015)
- Acquire the most recent title lists for the journal collections or databases you are comparing.
- Combine both lists into a single Excel spreadsheet on separate worksheets.
- Ensure that both lists have a common matchpoint, ISSN or ISBN are recommended.
- Because comparisons would be performed on these columns, ensure that ISSNs or ISBNs are similarly formatted (adding or removing dashes) and ensure that the format in Excel are the same (ex. Both are formatted as numbers).
Useful Excel Features and Formulas
There are a myriad of Excel features and formula options that you can use to massage your data. The features and formulas listed below are only suggestions to get you started.
Features
- FLASH FILL
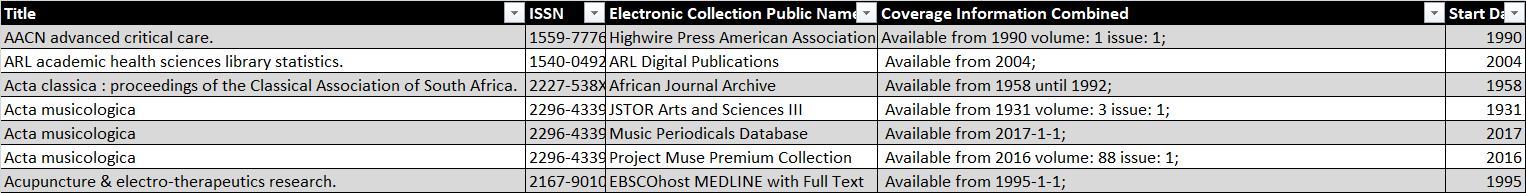
Data contained in publisher title lists, and/or data sourced from your library catalogue or ERMS may require ‘massaging’ in order to get the data into a form or format that will be usable and calculable. Flash Fill automatically fills your data when it senses a pattern. This feature is found under Editing–>Fill–>Flash Fill, on the Home tab.
In the example below the Start Date was manually entered for the first two titles, then Flash Fill was applied which filled in the remaining start dates.
- CONDITIONAL FORMATTING
Conditional formatting can be used to identify duplicates such as duplicate titles, ISSNs, or ISBNs. Feature found under the Styles section on the Home tab.
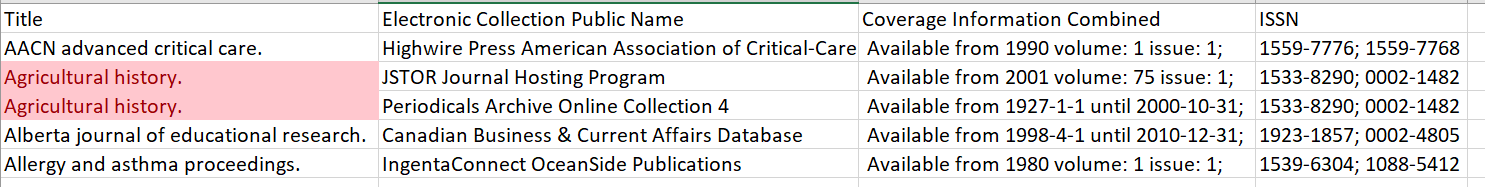
Example
- TEXT TO COLUMNS
Use to separate data into separate columns. Feature is found in the Data Tools section of the Data Tab.
Example
![]()
Formulas
The following site is a great resource for detailed information on Excel Functions and Formulas https://exceljet.net/excel-functions
1.IF FUNCTION
The IF function runs a logical test and returns one value for a TRUE result, and another for a FALSE result.
Syntax
=IF (logical_test, [value_if_true], [value_if_false])
Use
To compare coverage dates
Example
In cell E2 enter =IF(C2<=D2,”Alternative Access Same or Better”,”Publisher Start Date Better”)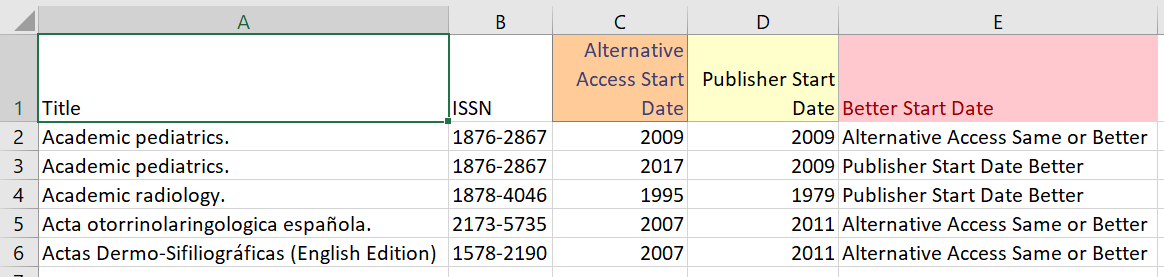
2. COUNTIF
Count cells in a range that meet a single condition.
Syntax
=COUNTIF (range, criteria)
Use
Really useful for determining matches (matching ISSN) among a list of ISSNs that span a number of Excel columns
Example
In cell D2 enter =COUNTIF($C$9:$E$16,A2) then copy the formula down the column.
1= there is only one match
2=there are two matches for this ISBN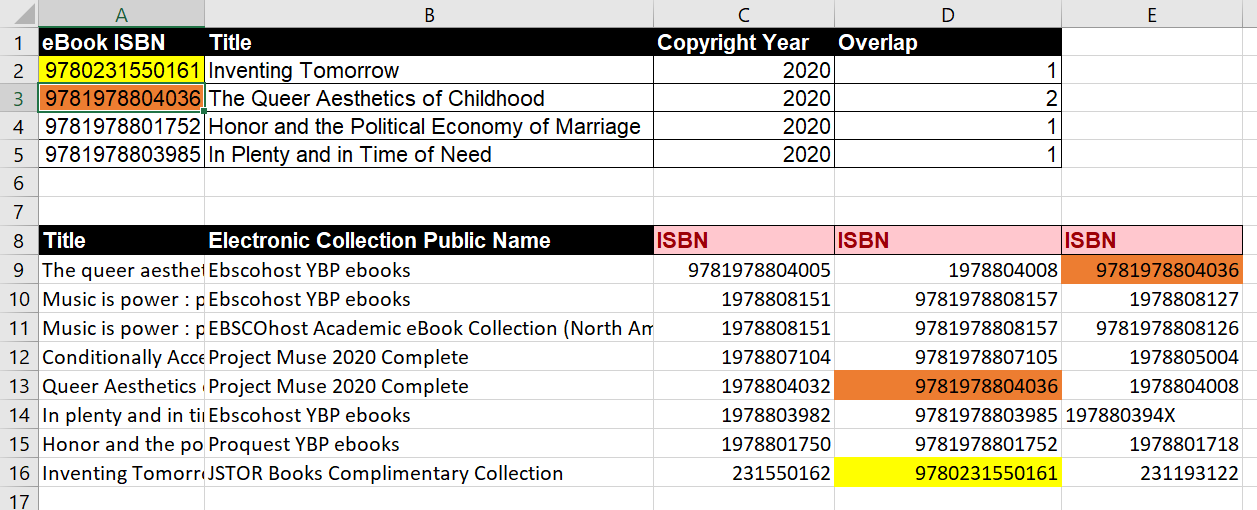
Note: Normally you would be comparing lists in different Worksheets or Workbooks. For the example above both lists were combined on one sheet.
3. IF & COUNTIF FUNCTIONS
Syntax
=IF(COUNTIF(range,criteria),“result if criteria met”,“result if criteria not met”)
Use
You can use this nested formula to compare two lists to see whether, for example, an ISSN or ISBN in one list exists in the other list and can return whatever value you assign.
Example
In cell C2 enter =IF(COUNTIF($C$12:$C$15,B2),“Yes”,“No”). Copy the formula down the column. 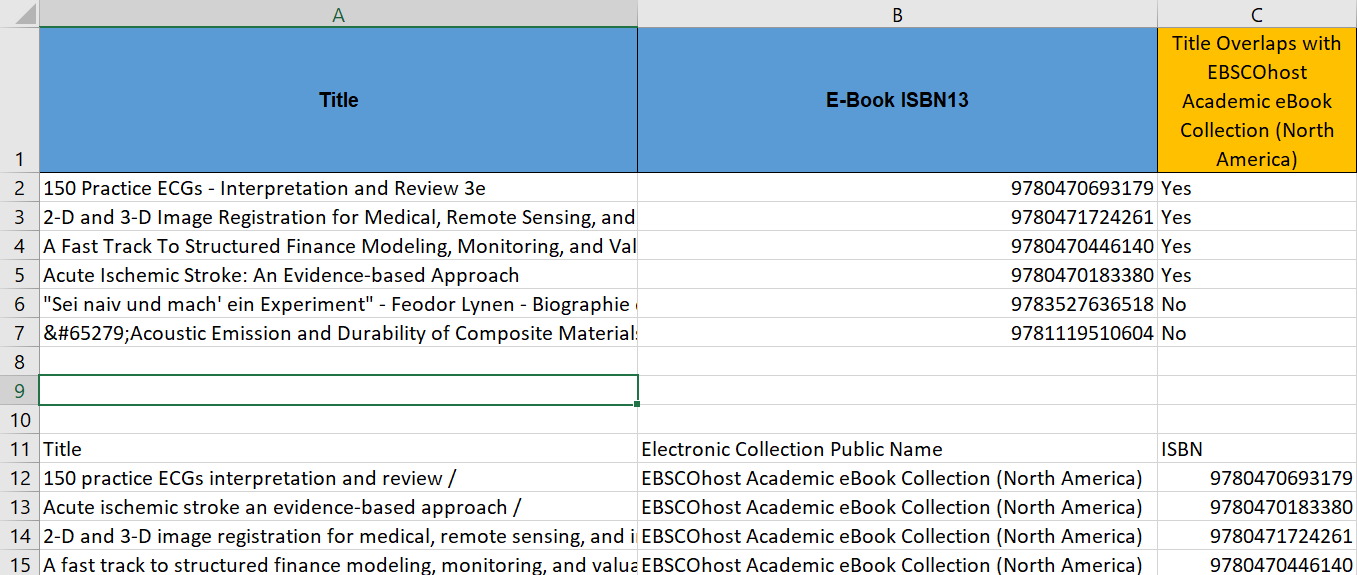
Note: Normally you would be comparing lists in different Worksheets or Workbooks. For the example above both lists were combined on one sheet.
4. COUNTIFS FUNCTION
The COUNTIFS function returns the count of cells that meet one or more criteria.
Syntax
=COUNTIFS (range1, criteria1, [range2], [criteria2], …)
Use
You can use this to summarize data. Cell B2, in the example below counts the number of titles to which this institution has current online access and that access is via the EBSCOhost Academic eBook Collection (North America).
Example
In cell B2 enter =COUNTIFS(C5:C12,C5,D5:D12,D5)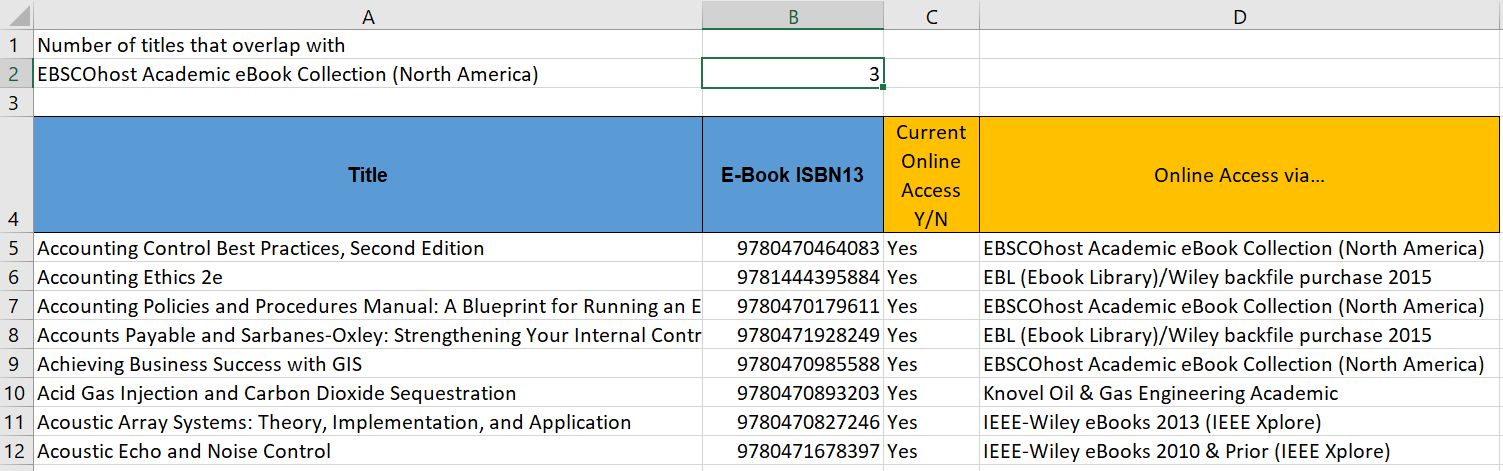
5. VLOOKUP
Use this function to look up data in a table organized vertically. VLOOKUP supports approximate and exact matching, and wildcards (* ?) for partial matches.
Syntax
=VLOOKUP(lookup value, table array, column index number, [range_lookup])
Use
Use VLOOKUP to find and pull in data from another workbook or sheet.
- Allows you to search on one piece of data and return related data from a table.
- Can automate the search and return process
- Works with text and numeric data
Example
In cell C2 we enter =VLOOKUP(B2,$B$14:$C$20,2,FALSE) and then copy the formula down the column to fill in the rest.
Note: Normally you would be comparing lists in different Worksheets or Workbooks. For the example above both lists were combined on one sheet.
6. REPLACE
REPLACE function replaces characters specified by location in a given text string with another text string.
Syntax
=REPLACE (old_text, start_num, num_chars, new_text)
Use
To add a dash to ISSN
Example
In cell C2 enter =REPLACE(B2,5,0,”-“).Then copy the formula down the column.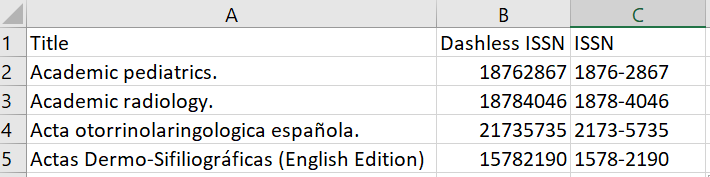
7. SUBSTITUTE
Use this function to replace text in a given string by matching
Syntax
=SUBSTITUTE (text, old_text, new_text, [instance])
Use
To remove dash from ISSN
Example
In cell C2 enter =SUBSTITUTE(B2,”-“,””)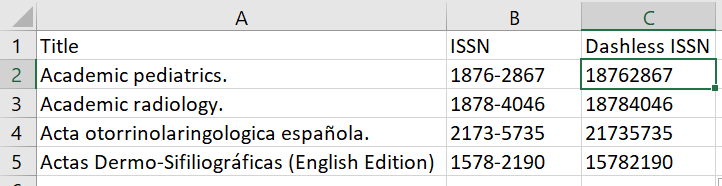
8. RIGHT
Extracts a given number of characters from the right side of a supplied text string.
Syntax
=RIGHT (text, [num_chars])
Use
Can be used to extract start or end coverage dates
9. LEFT
Extracts a given number of characters from the left side of a supplied text string.
Syntax
=LEFT (text, [num_chars])
Use
Can be used to extract start or end coverage dates
Example
In cell E2 enter =LEFT(D2,4). Then copy the formula down the column.
10. MID
Extracts a given number of characters from the middle of a supplied text string.
Syntax
=MID (text, start_num, num_chars)
Example
In the example below we use the =MID formula in cell E2 to extract the coverage end date from the string in D2 and then the =LEFT formula in cell F2 to extract only the date.
Formula in E2 =MID(D2,FIND(” until “,D2)+7,99)
Formula in F2 =LEFT(E2,4)
Other Useful Formulas
- =COUNTA count a range of cells that are not empty
- =COUNTBLANK count the number of cells that are empty
- =AND use to apply multiple tests to data [ex. =AND( B3=”RED”, C3>30)]
Bibliography
Belvadi, Melissa. (2015). Do-it-yourself title overlap comparisons. Proceedings of the Charleston Library Conference. http://dx.doi.org/10.5703/1288284316261
Blecic, D., Wiberley, S., Fiscella, J., Bahnmaier-Blaszczak, S., & Lowery, R. (2013). Deal or no deal? Evaluating big deals and their journals. College & Research Libraries, 74(2), 178-194, https://doi.org/10.5860/crl-300
ExcelJet (2020). Excel Function List. Retrieved November 30, 2020, from https://exceljet.net/excel-functions
Harker, Karen R. & Kizhakkethil, Priya. (2015). The quick and the dirty: The good, the bad, and the ugly of database overlap at the journal title level. The Serials Librarian, 68(1-4), 249-254, https://10.1080/0361526X.2015.1016858
Pope, Barbara M. (2017). Making room for change: Rightsizing PSU’s Axe Library serials collection. Kansas Library Association College and University Libraries Section Proceedings: 7(1), https://doi.org/10.4148/2160-942X.1066
Vancouver Island University. (n.d.). Assessment @ VIU Library: Overlap Analysis Retrieved September 18, 2020, from https://library.viu.ca/assessment
Zorian M. Sasyk & Amanda K. Lewis. (2019). Overlap analysis, usage statistics, and the evaluation of aggregator databases. Journal of Electronic Resources Librarianship, 31(2), 120-122, https://10.1080/1941126X.2019.1597459