John P. Blosser, Northwestern University
Rachel A. Erb, Florida Virtual Campus (FLVC)
Cost per use (CPU) analysis is a method to measure the investment value of a collection’s online resources by calculating the per unit price of a resource divided by the number of times the resource was used.
CPU=price/usage
Example: a $600 journal title with 500 uses in a 12-month period
$1.20=$600/500
The unit may be an e-journal or an e-book title, a database or a bundle of e-journals or e-books, and if there is a way to gather usage counts for physical collections, the CPU can be applied to physical collections. The CPU method is a quantitative method to use when evaluating collections, but should be used in conjunction with qualitative assessments of a resource in order to show a more rounded evaluation of the resource.
The purpose of a CPU analysis can be varied. The following are some examples.
- Most commonly, CPU analyses are used to help make decisions on renewing online resources’ titles. The CPU gives an indication of the return on investment, but also a rough idea of how much a title is used in support of research and teaching.
- Cost containment projects often make use of CPU analyses in order to establish criteria for keeping or cancelling titles both on a per title basis and in comparison to titles with similar or related subject coverage.
- If one is able to capture user status, for example, faculty, graduate, or undergraduate, one may be able to see a pattern of use for which resources are important for teaching and learning, or for research support. Sometimes a report of use by IP address may help if one has a list of campus IPs and building assignments to correlate with research centers.
- Transformative agreement analysis uses CPU to compare costs of subscriptions for various categories, such as citation count for the institutions’ authors, how much open access is available through the publisher, or the cost or savings of cancelling a bundle of journals vs. the extra cost of ILL or document delivery.
There are four basic components to a CPU methodology:
- Gather the usage statistics.
- Archive the usage statistics for use over time.
- Calculate the CPU.
- Share the results of the CPU assessment with liaisons and administrators.
Gather the Usage Statistics
The majority of publishers and platform providers for online resources make available usage statistics for the resources they provide on an annual basis, usually by the calendar year. Some publishers may provide only a few of the recent months. Those publishers and platform providers that allow customers administrative access to the publishing platform often have the option to gather usage statistics by other customized time frames. One may gather the usage statistics annually or as needed, but unless usage statistics are needed more often, gathering them once a year starting in mid-to-late February will usually be enough time for the publishers and platform providers to have loaded the statistics for the previous full calendar year. Gathering usage statistics for multiple publishers and platforms allows use of the CPU to compare value across publishers.
The downloads of the usage statistics are usually in a spreadsheet format that follows the standards of the COUNTER 4 or the more recent COUNTER 5 usage statistics protocol. Automated gathering of usage statistics through the SUSHI protocol is also available for use with many publishers. The local library services platform may be able to store the SUSHI-gathered statistics. LibInsight is another potential data storage platform. Alternatively, spreadsheets may be stored on a local server.
Archive the Usage Statistics
Historical data reveals trends of use throughout a 12-month period and over several periods. Store the spreadsheets of usage statistics to build an archive of additional assessment criteria that will help track the value of paying for the resource.
Combining Title Lists with Usage Data
One of the first analysis steps involves generating relevant e-journal title lists to serve as the foundation to build the cost per use analytical report. This is not a simple task because e-journal title information may reside in disparate silos such as the ERMS, OpenURL knowledgebase, and ILS. The degree of integration of these systems may vary by an individual library’s technological landscape. As a general rule, there are fewer silos within some next-generation library services platforms. There is at least one next-generation library services platform, ExLibris’s Alma, that can generate this report using its Analytics module. The free, open source tool OpenRefine may help in managing the data needed for the analysis.
Whatever the data source, the title list can be created by exporting a data file and importing it into a spreadsheet. The title list should contain data such as title, vendor/publisher, price, order record numbers, fund codes, ISSN/e-ISSN, and coverage dates, and can include additional data depending on the institution’s needs. If it is not possible to export coverage dates, then the publisher’s KBART-formatted journal title list would have to be merged with either a COUNTER 4 JR1 or a COUNTER 5 Title Master report—or both.
The exported file with local acquisitions data then can be merged with the usage data. The challenge is finding a consistent match point between the title list data and the COUNTER usage report. ISSN/e-ISSN matches can be used to consolidate the two reports, but this data can be missing and/or incorrect.
A member of the COUNTER Executive Committee, Kornelia Junge, provided a tutorial that explains how to leverage VLOOKUP formulas when comparing COUNTER usage data across spreadsheets. Beginning at 13:55 in the course, Junge explains how to use this formula to consolidate COUNTER 4 and COUNTER 5 usage statistics.
Cost Per Use Using Title Lists
Building upon the merged report that includes local subscription data, COUNTER usage, and the KBART title list, then the cost-per-use formula can be applied at the title level. If list price is available at the title level, then another cost-per-use formula can be applied to the list price, as well. The titles in the CPU report can also be mapped to subject areas using LC classification or academic department names.
Cost Per Use Thresholds
The cost per use analysis can be structured to include CPU thresholds by expenditures and cost per use. For example, Michael Arthur (2018) offers a case study from the University of Alabama (see table 1), in which resources are tallied by both price range and cost per use.
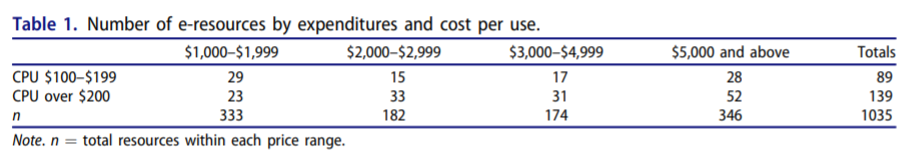
These CPU thresholds (greater or less than $200) reflect what might be appropriate for a large research collection, and certainly other thresholds can be used within the analysis. CPU thresholds should be discussed and determined by project members. It is useful to consider the institution’s overall continuing resources budget. In other words, the larger the continuing resources budget, the greater the acceptable CPU threshold for retaining titles; and the converse may be applicable for institutions with smaller continuing resources budgets.
Cost Per Use Options for Further Analysis
- Average: The number that is the result of dividing the total number by the number of individual titles in the list. Basing decisions on an average can hide the fact that there are only a few high-use titles and many low-use titles.
- Median: The number that falls in the middle of all numbers listed. The median gives a slightly better sense of scale of use than the average because it is not skewed by outliers in either cost or use.
- Quadrant Comparisons: Setting up quadrants can help put use numbers in a rough sort to quickly see where the bulk of usage resides in a low-to-high or a high-to-low comparison. Sort the usage statistics in descending number order and then mark four sections of usage ranges. For example, a common rough sort of usage might be Quadrant A, for usage counts of zero or one use; Quadrant B, for usage counts of between 2-10 uses; Quadrant C, for usage counts of between 11 and 500 uses; and, Quadrant D, for usage counts from 501 uses and above. Then count the number of titles in each quadrant. If the higher title counts fall within the lower usage quadrants, that would indicate less substantive use by a lot of people, with not many repeat uses, and possibly a lower value of return on the cost. Higher title counts that fall within the higher usage quadrants would mean that there is more substantive use, more repeat uses, and possibly a higher value of return on the cost. If higher title counts fall across the two middle quadrants, that would indicate broad use and possibly a good value of return on cost. If the lowest title counts fall within the highest usage quadrant, and depending on what is shown in the middle quadrants, it might indicate that you can subscribe individually to those few highly used titles at a lesser cost than the package of all the titles.
- Sample of low use for a bundle of 4,000 titles:
| Quad C:
Uses per title: 11–500 450 titles |
Quad D:
Uses per title: 501+ 50 titles |
| Quad A:
Uses per title: 0–1 3,000 titles |
Quad B:
Uses per title: 2–10 500 titles |
- Sample of high use for a bundle of 4,000 titles:
| Quad C:
Uses per title: 11–500 3,000 titles |
Quad D:
Uses per title: 501+ 450 titles |
| Quad A:
Uses per title: 0–1 50 titles |
Quad B:
Uses per title: 2–10 500 titles |
- Thresholds: Establishing criteria which a resource can be evaluated against relative to high use and low cost is another way to put a rough sort on usage.
- By use: Decide on a usage number below which low usage is not considered impactful. For example, if 100 uses is chosen as a good mark of usage, does the title in question fall below the threshold?
- By cost per use: Decide on a cost per use above which higher cost per use is considered unacceptable. For example, if $50 cost per use is chosen as a good mark of cost per use, does the title in question sit above the threshold? This threshold might be based on the cost of alternative access to a non-subscribed resource.
- Publisher comparison: Comparing publishers of similar subject material can help determine if a given publisher falls within an expected performance range of use and cost per use. This may inform a decision not to continue with titles that are getting low use since there may be other publishers in the collection that are meeting the needs of students, faculty, and researchers.
Other Evaluation Considerations
There are other metrics that can help with retention decisions.
- ILL costs: Including the costs of ILL or on-demand article purchasing can be used to compare the price of maintaining a subscription or bundle of titles. From a service perspective, the time required to request an article and its receipt by the user can also be considered. (See more details in the “Interlibrary Loan” section below.)
- By citations to local authors: Does the citation data show that the title has many citations to the institution’s authors, or is the title publishing many articles of the institution’s authors? Resources such as the Web of Science or Scopus can help analyze citations and where authors are publishing.
- For selected titles/collections: Categories of users can be informative in trying to decide on retention of titles. Make every effort to respect user privacy when collecting these data.
- If faculty and researchers are using a particular title, this information may weigh heavily in favor of keeping it even if total usage is lower than other titles.
- Use by graduate or undergraduate students may give insight for other titles.
- Impact for or importance to major university programs may weigh in favor of keeping a title.
- These measures can be facilitated by some authentication software like OpenAthens or EZproxy.
- The user category parameter can disaggregate the usage data. The following formula is an example in which weights are applied for the different user groups.
User category formula: Usage = (1Uf +.75Ug +.50Uug + 0Uo)/Cost
(f=faculty; g=graduate; ug=undergraduate; o=other)
This and other formulas for quality of usage and time requirement of usage are also available (Kendrick, 2019).
Interlibrary Loan
The costs per interlibrary loan can be considered when evaluating the CPU. Cost per interlibrary loan (ILL) can be calculated using the hourly rate of staff to process the ILL along with borrowing and/or copyright fees. OCLC’s ILL Cost Calculator can assist with determining an institution’s actual average ILL. A case study at Iowa State University involved using the mean ILL cost reported by the Association of Research Libraries as a threshold for retention. That is, they would retain a subscription where the calculated cost per use did not exceed the mean ILL cost over a three year period (Pedersen et al., 2014). While Iowa State University determined that ILL cost data was their “primary criterion” for subscription decisions, their model can also serve as an adjunct to cost-per-use studies calculated with COUNTER or vendor supplied usage statistics.
Share the Results of the CPU Assessment
It is best to make the usage statistics available to others for self-service access. It is important to share assessments in formal or informal reports to the liaisons who are responsible for the subject areas covered and who may have been the ones to select the titles. Periodic reports on the value of the resources being retained usually are interesting to administrators as well, within or sometimes outside of the library.
Cost Per Use Limitations
Cost per use remains an important factor in determining the allocation of funds to maintain e-journal subscriptions. There are, however, some limitations to cost per use that indicate it may be an imperfect metric to use as the sole means for evaluation.
Cost per use does not account for differences in user group patterns. In Curtis Kendrick’s guest post “Cost per Use Overvalues Journal Subscriptions” in the Scholarly Kitchen, he illustrates this point by explaining that “not all usage is equal, not all usage has equal value.” For example, an undergraduate student downloading an article from a prestigious journal is “qualitatively different” than a researcher downloading articles from the same journal to complete a grant application. The stakes are greater for the researcher in comparison to the undergraduate as the latter could find another suitable article from a markedly less costly resource. Meanwhile the researcher’s work could result in obtaining grant funding which benefits the institution. Kendrick offers refined cost-per-use formulas that could take into account various user groups, but most institutions do not have the technological capability to track this data in their current environments.
The manner in which current and backfile content is purchased adds another layer of complexity to this analysis. Journal backfile usage is often combined with current journal usage for the same title. Because backfiles are typically purchased with one-time funds, and current journals are subscribed to each year, it can be difficult to accurately calculate cost per use for current subscriptions. Backfile purchases sometimes pose another challenge—hosting fees are sometimes included in the costs. More often than not these costs are not factored into cost per use, and therefore, the true cost per use may not be reflected in the calculation.
Publisher-supplied usage data, most commonly in the form of Counting Online Usage of Networked Electronic Resources (COUNTER) reports, also must be reviewed with a critical eye. COUNTER e-journal usage reports include the number of full-text downloads per journal. Most publishers provide either COUNTER 4 JR1 reports or COUNTER 5 Title Master reports; there are a few who provide both reports for some years prior to fully migrating to COUNTER 5. One problem with applying the number of full-text downloads metric to the cost-per use formula is that it assumes the user not only read the article, but also included it in their research. The number of downloads do not fully explain the user journey, which could have involved skimming the article and rejecting using it for their research. In other words, there are numerous value scenarios surrounding “use.”
A compelling illustration of the problems posed by COUNTER usage reports is a longitudinal study conducted by Wood-Doughty, Bergstrom, and Stiegerwald (2019). They evaluated download records from the California Digital Library (CDL), which includes subscriptions from ten institutions. The records “represent about 4.25 million downloads from 7,724 journals published by seven publishers during the years 2010–2016.” They observed that there is a strong correlation between download and citation rates but that this can vary according to discipline. For example, the ratio of downloads to citations is higher in the humanities in comparison to the physical sciences. In general, the “ratio tends to be higher for journals with higher impact factors.” The authors asserted that libraries should use download usage data in determining subscription expenditures but noted that the evaluation of e-journals could be augmented by using citation data alongside usage data.
In evaluating the usage data supplied by the seven publishers Wood-Doughty et al. (2019) observed that there are “large differences in the ratio of reported PDF downloads to reported total downloads,” which led them to conclude that it is possible that “actual usage is exaggerated” by some publishers’ counting both the PDF download and the HTML access. Helpfully, the authors provide deflation factors for major publishers that could be used for further refinement of usage data prior to calculating cost per use.
Different problems with COUNTER usage reports that may also reside with the publisher were noted by Pastva et al. (2018), including missing and erroneous data. They also observed “inconsistent practices of individual providers,” but they did not provide specific examples.
Bucknell (2012), however, offers the most comprehensive analysis of the viability of COUNTER or other vendor-supplied usage data that will impact cost-per-use figures. He prescribes approaches to account for such misleading problems as the following:
- Platform differences that affect the number of downloads
- The probability of the inflation of the number of downloads
- Content changes due to new launches; conversions to open access
- The question of including backfile usage data
- The variance of cost per download across disciplines
- The differences in content quality
- Unusual usage upticks
- Title transfers not accurately accounted for due to various disruptions during the transfer year
- Title changes with legacy ISSNs
- Subscription to one title includes several other titles
- Hybrid journals that are a mixture of open access and subscribed content
- The inclusion of aggregator platform e-journal usage
- The question of the true cost when factoring in surcharges and discounts
- Statistical fluctuations due to changes in user behavior over time.
While cost-per-use metrics are still relevant for evaluating e-journal collections, we would advise judicious consideration of usage data and periodic surveys of current literature on the topic.
Cited Works
Arthur, M.A., (2018). Managing a comprehensive cost-per-use project in a large academic library. Serials Review, 44(4), 299–306. https://doi.org/10.1080/00987913.2018.1558936
Bucknell, T. (2012). Garbage in, gospel out: twelve reasons why librarians should not accept cost-per-download figures at face value. The Serials Librarian, 63, 192–212. https://doi.org/10.1080/0361526X.2012.680687
Junge, K. COUNTER Foundation Class 10: Working with COUNTER 5 reports in Microsoft Excel, October 31, 2019: https://www.youtube.com/watch?v=AU_DBLi4hSo
Kendrick, C. Cost per use overvalues journal subscriptions. The Scholarly Kitchen, Guest Post, Sept. 5, 2019: https://scholarlykitchen.sspnet.org/2019/09/05/guest-post-cost-per-use-overvalues-journal-subscriptions/
Pastva, J., Shank, J., Gutzman, K., Kaul, M., Kubilius, R. (2018). Capturing and analyzing publication, citation, and usage data for contextual collection development. The Serials Librarian, 74(1–4), 102–110. https://www.tandfonline.com/doi/full/10.1080/0361526X.2018.1427996
Pedersen, W. A., Arcand, J., Forbis, M. (2014). The big deal, interlibrary loan, and building the user-centered journal collection: A case study. Serials Review, 40, 242–250. https://doi.org/10.1080/00987913.2014.975650
Wood-Doughty, A., Bergstrom, T., and Steigerwald, D. (2019). Do download reports reliably measure journal usage? Trusting the fox to count your hens? College and Research Libraries, 80(5), 1–47. https://crl.acrl.org/index.php/crl/rt/printerFriendly/17824/19653