Hana Levay, University of Washington
Introduction
COUNTER 4 offered many different types of reports depending on the type of content, interface, and type of user activity. Each report was formatted differently and contained different types of data.The goal of COUNTER 5 was to reduce the total number of types of reports and allow for future changes without needing to redo report structure. Because of this goal, there have been significant changes between COUNTER 4 and COUNTER 5 which has had a significant impact on both vendors and librarians. In the long term, this will be the last major change we will need to undertake for the foreseeable future.
COUNTER 5 improves the way we measure usage to more accurately reflect user intentions. However, during the transition period, we will need to find the best way to compare COUNTER 4 data to COUNTER 5 data despite all the changes.
This document will help the librarian understand the changes between COUNTER 4 and COUNTER 5 to support longitudinal — year over year — analysis. There are some rules of thumb that can be used to make comparisons that will be shared in the following sections; however, in practice, there can be significant discrepancies when looking at particular examples. It is beyond the scope of this document to outline vendor-specific discrepancies, but do take note that values may change between COUNTER 4 and COUNTER 5 for the same time period and use case.
This document will describe the changes made to the usage reports and show examples using COUNTER 4 and COUNTER 5 reports for the year 2020 at the University of Washington.
Definitions
Some terms used when discussing usage include:
- Content item: The information-bearing element of the resource. Examples include full-text article, ebook, ebook chapter or section, metadata pages, or multimedia file. This does not include aspects of the user interface such as help pages, menus, or navigation trees.
- Database versus Platform: A platform is an interface from an Aggregator, Host, Publisher or Service that delivers the content to the user and that counts and provides the COUNTER usage reports. A platform may consist of a collection of several different databases. Usage can be attributed to the platform as a whole or to the individual databases or collections connected to the platform. Depending on your needs, you may want usage reports at the individual database level or at the greater platform level.
- “Host Site” or “Discovery Service”: A platform, aggregating service or federated search engine where multiple databases can be searched without user selection of databases. An intermediary online service which stores items that can be downloaded by the user.
- User session: A session usually starts when a user first accesses a platform or logs in, and the session ends when the user logs out or the session is timed out. Some platforms do not use sessions. In this case, for the COUNTER reports, the day is divided into 24 one-hour slices. All usage from the same IP address with the same user agent within the same one-hour slice is regarded as one session. (Hendry)
COUNTER 4 reports
The COUNTER 4 reports that are being deprecated include sets of reports specifically created for various types of ejournal, ebook, database, platform, and multimedia usage. These include reports such as:
- Journal Report 1 (JR1) – Number of Successful Full-Text Article Requests by Month and Journal
- Journal Report 1 Gold Open Access (JR1GOA) – Number of Successful Gold Open Access Full-Text Article Requests by Month and Journal
- Book Report 1 (BR1) – Number of Successful Title Requests by Month and Title
- Book Report 2 (BR2) – Number of Successful Section Requests by Month and Title
- Database Report 1 (DB1)
Each report was formatted differently and applied only to one type of content item. The metrics were specific to each report. Of particular note, there were two ebook reports: one for counting use by chapter or section and one for counting use by title. It was very difficult to compare ebook usage between the two reports.
COUNTER 5 reports
Two important new metrics are included in COUNTER 5: Investigations and Requests. Investigations count all kinds of activity with content items, including views or downloads of full- content items. Requests only count the viewing or downloading of full-content items. Requests will therefore be a subset of Investigations.
Another data element new to COUNTER 5 is the “total” versus “unique” activity counts. The “total” method of counting measures all activity during a session — even duplicate activity such as viewing the same content item twice — while the “unique” method of counting only measures interactions with a content item once per session.
There are four types of master reports in COUNTER 5: Platform, Database, Title, and Item. Each of these master reports can be customized to fit your needs. Several common customizations have been formalized into “Standard Views” and are offered by most usage providers. Some common Standard Views include:
- TR_B1: Title Master Report limited to ebook metrics;
- TR_B3: Title Master Report limited to ebook usage by access type
- TR_J1, which is the Title Master Report limited to ejournal metrics and does NOT include open access usage;
- TR_J3, which is the Title Master Report limited to ejournal metrics and also including access type (such as Controlled versus Open Access); and
- DR_D1, which is the Database Master Report limited to key metrics of interest for database usage.
Journal Reports
Comparing COUNTER 4 to COUNTER 5 Summary:
The COUNTER 4 JR1 report counted full-text article downloads for both controlled (licensed) access and for open access articles. COUNTER 5 TR_J1 does not count open access article downloads. Therefore, you will have to do one of two things: compare the JR1 to the TR_J3 report, adding together all access types in the TR_J3 report; or, you may first subtract the COUNTER 4 JR1GOA values from the JR1 to get the values in the COUNTER 5 TR_J1 report.
COUNTER 4 JR1 = COUNTER 5 TR_J3 Controlled Total_Item_Requests + Open Access Controlled Total_Item_Requests
OR
COUNTER 4 JR1 – COUNTER 4 JR1GOA = COUNTER 5 TR_J1 Total_Item_Requests
Example: COUNTER 4 JR1 = COUNTER 5 TR_J3 Controlled Total_Item_Requests + Open Access Controlled Total_Item_Requests
Figure 1:
Figure 2:
Figure 1 shows the COUNTER 4 JR1 report with 110 full-text article requests (including HTML, PDF, and other) for the journal AEU. Figure 2 of the COUNTER 5 TR_J3 report shows 109 Controlled Total_Item_Requests and 1 OA_Gold Total_Item_requests for the same journal. Adding 109 plus 1 gives 110. Notice that the TR_J3 shows many other data elements including investigations and total versus unique. These are new data elements to COUNTER 5 where there is no match to COUNTER 4 data.
For the journal ACC, you can see in the TR_J3 report that there was no open access usage. Therefore, you may simply directly compare the value from the JR1 of 15 full-text article requests to the TR_J3 value for Controlled Total_Item_Requests of 15.
Example: Subtract JR1GOA from COUNTER 4 JR1
Figure 3: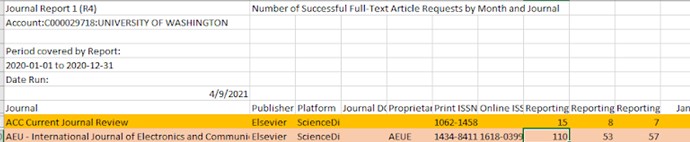
Figure 4:
Figure 5: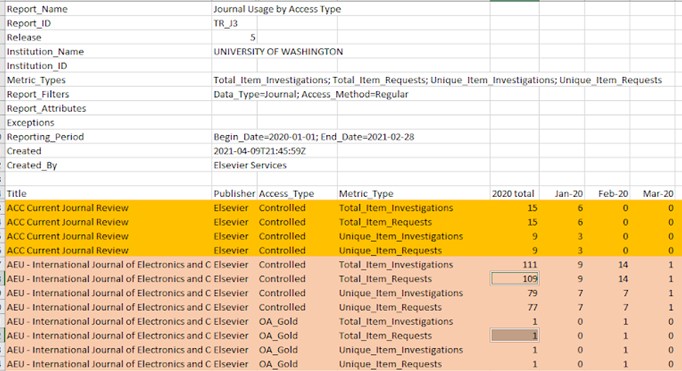
Figure 3 of the COUNTER 4 JR1 shows 110 full-text article requests (including HTML, PDF, and other) for the journal AEU. Figure 4 of the COUNTER 4 JR1GOA report shows 1 Gold Open Access full-text article request. Subtracting 1 from 110 gives 109, the number of Total_Item_Requests from the COUNTER 5 TR_J1 report as seen in Figure 5.
The journal ACC does not appear in the COUNTER 4 JR1GOA report, which means it had zero Gold Open Access full-text article requests. You can also see in the TR_J3 report that there was no open access usage. Therefore, you may simply directly compare the value from the JR1 of 15 full-text article requests to the TR_J3 value for Controlled Total_Item_Requests of 15.
Moving Forward
Moving forward, we plan to use the COUNTER 5 TR_J1 Unique Item Requests value. We feel this metric best reflects user intent by excluding duplicated activity such as viewing the HTML version and subsequently downloading the PDF. Also, by not counting open access article requests, only measures paid use.
Book Reports
Comparing COUNTER 4 to COUNTER 5 Summary:
In general, there will be a direct correlation from section and title request data in COUNTER 4 to metrics in the COUNTER 5 book reports. The COUNTER 5 book reports will also contain several new metrics not available in COUNTER 4. Additionally, section and title level counts will appear in the same report in COUNTER 5, rather than the two separate reports in COUNTER 4.
COUNTER 4 BR1 = COUNTER 5 TR_B1 Unique_Title_Requests
OR
COUNTER 4 BR2 = COUNTER 5 TR_B1 Total_Item_Requests
Example: COUNTER 4 BR1
Figure 6:
Figure 7:
In Figure 6, we see the COUNTER 4 BR1 report showing the number of successful title requests. We can see a direct equivalency between these values and the “Unique_Title_Requests” in the COUNTER 5 TR_B1 report (Figure 7) for the same titles. For example, in Figure 6, “African Economic Outlook 2017” had 3 successful title requests in 2020, and in Figure 7, the same title shows 3 Unique_Title_requests. As we will discuss in the following section, the blue shaded rows in Figure 7 would match up with the COUNTER 4 BR2 report.
Example: COUNTER 4 BR2
Figure 8 shows a COUNTER 4 BR2 report; that is, counts at the chapter or section level. In this COUNTER 4 BR2 report, the title “After the Soviet Empire” had 9 section or chapter views in 2020.
Figure 8: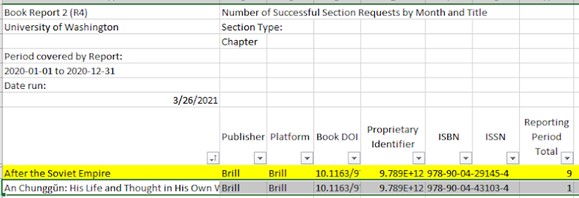
In the COUNTER 5 TR_B1 report (Figure 9), the title “After the Soviet Empire” shows 9 Total_Item_Requests — there were 9 sections of chapters viewed from this title in 2020. This is the same value as we saw in the COUNTER 4 BR2 report.
Figure 9:
In Figure 9, notice that the title “After the Soviet Empire” also shows 7 Unique_Title_Requests; that is, the title as a whole was accessed 7 unique times. Brill did not supply COUNTER 4 BR1 reports, so this is new information we could not access before.
Moving Forward
Moving forward, we will use both Unique_Title_Requests and Total_Item_Requests from the COUNTER 5 TR_B1 report. The Unique_Title_Requests metric is most comparable to traditional print circulation counts, whereas Total_Item_Requests can be used to determine depth of usage of a title. Perhaps there is one chapter in a book that is mostly being accessed; in that case, Unique_Title_Requests and Total_Item_Requests would be nearly equal. Or, some titles such as proceedings may have a large number of section requests per title. Both figures are of future interest.
We have started using a new calculated metric called sections per book found by dividing Total_Item_requests by Unique_Title_Requests that can help indicate the depth of interest in a book. In the example above for “After the Soviet Empire”, we would calculate 9/7 = 1.3 chapters per title were accessed in 2020.
Database reports
Unfortunately, it is nearly impossible to compare database reports between COUNTER 4 and COUNTER 5. The definitions of usage changes quite dramatically between versions. While some vendors may have comparable data for some metrics, others do not. There is no consistent pattern to be found on the whole. To see why this is, let’s look at the definitions more closely.
COUNTER 4 Key Data Elements for Database Reports
| Regular Searches | Number of searches conducted against a user-selected database where results are returned to the user on the host user interface. |
| Result Clicks | Result Clicks count all the “clicks” originating from the result list displayed by a search or browse. A “click” is counted when a user activates a link. This includes links to external resources, as well as records included in the databases on that platform. It does not count clicks from external sources that lead directly to database content. |
| Record Views | Record Views cover only views of the detailed metadata (e.g. an abstract view) of records from databases on that platform. It does not count full-text downloads. |
COUNTER 5 Key Data Elements
| Searches_Regular | Number of searches conducted against a user-selected database where results are returned to the user on the host UI. The user is responsible for selecting the “Databases” or set of data to be “Searched”. This metric only applies to usage tracked at the “Database” level and is not represented at the “Platform” level. |
| Searches_Automated | Searches conducted on the “Host Site” or “Discovery Service” where results are returned in the host-site UI and multiple databases are searched without user selection of “Databases”. This metric only applies to usage that is tracked at the “Database” level but is not represented at the “Platform” level. |
| Searches_Federated | Searches conducted by a federated search engine where the search activity is conducted remotely via client-server technology. This metric only applies to usage that is tracked at the “Database” level but is not represented at the “Platform” level. |
| Total_Item_Investigations | Total number of times a content item or information related to a content item was accessed. Double-click filters are applied to these transactions. |
| Unique_Item_Investigations | Number of unique content Items investigated in a user-session. |
| Total_Item_Requests | Total number of times a full-text content item is downloaded. |
| Unique_Item_Requests | Number of unique full-text content items downloaded in a user-session. |
Comparing COUNTER 4 to COUNTER 5 Summary
Searches: Theoretically, you should be able to directly compare searches from COUNTER 4 to COUNTER 5. However, in practice, we have noticed that while some databases show the same value for the same month when comparing COUNTER 4 to COUNTER 5, other databases show quite different values.
We found that only 31% of databases tested showed the same value from COUNTER 4 to COUNTER 5 over the same time period, while 6% had smaller values for COUNTER 5 and 63% had larger values for COUNTER 5. While the official definition of a search did not change, it would appear that vendors took the opportunity to refine their own algorithms during this transition.
Result Clicks: This metric counts “clicks”, or activated links, between a list of results and a content item. It also omitted any usage where the user entered a platform and landed directly on the document page such as using a direct link to a content item. COUNTER 5 does not measure “clicks” or activated links at any point; therefore, this metric is obsolete in COUNTER 5. That said, we did find Result Clicks matched quite well against Total Item Investigations for many Ebsco databases.
Record Views: Theoretically, we might assume from the definitions that:
COUNTER 4 Record Views = COUNTER 5 Total Item Investigations – COUNTER 5 Total Item Requests.
However, looking at the actual data shows that these numbers rarely match up. Some vendors may have data that matches better here than others.
Moving forward: The consensus seems to be to use searches from the DR_D1 reports moving on. You may also want to use Total_Item_Investigations for deciding the breadth of usage. Total_Item_Requests will only apply if the content item is a full-text or full multimedia item. Abstracting and Indexing databases will not have values for the Total_Item_Requests metric.
Example: searches
Generally speaking, COUNTER 4 Regular Searches correspond to COUNTER 5 Searches_Regular. The COUNTER 5 metrics of Searches_Automated, and Searches_Federated may also appear for some platforms.
In Figure 10 you can see a COUNTER 4 DR1 report filtered to show “Regular Searches” for each database in the Adam Matthew Digital platform. Specifically, you can see that “Archives Direct” had 12 searches in 2020.
Figure 10: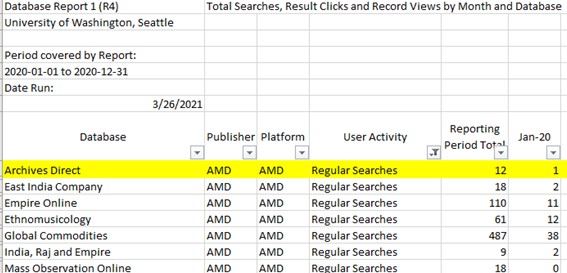
In Figure 11, you can see the “Searches Regular” metric in the COUNTER 5 DR_D1 report for 2020. In this case, you can see that “Archives Direct” had 16 searches in 2020.
Figure 11: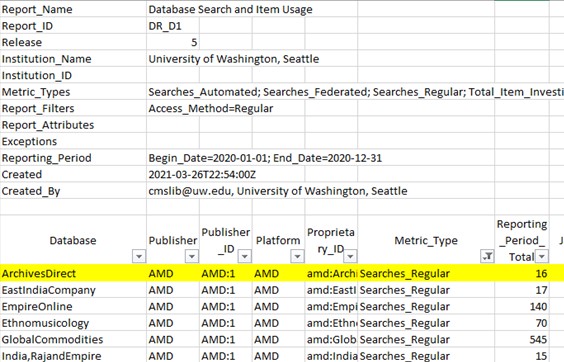
This kind of discrepancy was noted in many of the databases we checked, while others showed equal values.
Other platform specific examples
ProQuest Database reports
When asked about how ProQuest COUNTER 4 and COUNTER 5 metrics can be compared to each other, a ProQuest representative wrote on August 25, 2020:
It is essentially the case that, for database-level metrics, comparison is difficult because COUNTER 4 was missing any true database-level metric equivalent to Investigations/Requests (or Retrievals, in the non-COUNTER ProQuest database reports).
Neither of the COUNTER 4 database metrics, Result Clicks and Record Views, offered anything close to a complete count of the actual database usage. Record Views did not include full text formats, and Result Clicks omitted any usage where the user entered the ProQuest platform directly on the document page (for example, having been referred there by the library’s discovery service) – which accounts for over half of all visits to the platform.
Happily, this has been rectified with COUNTER 5.
Description of report: COUNTER 4 DB1 – 2019
Metrics: Searches-federated and automated, Regular Searches, Record Views, Result Clicks
Database names on the report reflect both collection names and component databases. Example: Collection name “Agricultural & Environmental Science Collection” with “Agricultural & Environmental Science Collection->AGRICOLA” as a component database, with additional naming changes appearing between March and April 2019. (The naming convention switched from “Agricultural & Environmental Science Collection->AGRICOLA” to “Agricultural & Environmental Science Collection->Agricultural Science Collection->AGRICOLA” in April 2019, with usage showing for the appropriate months and zeros elsewhere.)
Collection names and component databases all show the same types of metrics. It is unknown how the collection metrics correlate with the component database metrics. For example, if you add “Record Views” of all databases in the “Agricultural & Environmental Science Collection”, you get 17,250, which is much larger than the “Record Views” recorded at the collection level: 2,659. It appears that activity can be attributed to one or more of the component databases in the collection and should not be totaled for the collection.
With this set-up, it is easy to see which databases are organized into which collections. However, it is difficult to glean meaning from the metrics of the larger collection.
Description of report: COUNTER 5 Database Master Report – 2019
Metrics: Searches_Automated; Searches_Federated (not used at UW); Searches_Regular; Total_Item_Investigations; Total_Item_Requests
Database names listed for both larger groupings and individual component databases. Individual component databases show only their names, not the collection they are in. Collection names only use the “Searches_Regular” metric while the component databases use metrics of “Searches_Automated”, “Total_Item_Investigations”, and “Total_Item_Requests”. This configuration makes it much easier to determine usage for specific databases as well as the collection as a whole, but makes it harder to determine which databases belong to which collections. However, one can use other data outside of the COUNTER reports to make that determination (ProQuest title lists, holdings data, etc).
Data element: Proprietary_ID added – code to refer to specific databases. Example: AFI Catalog = “afi”
Data matching between C4 and C5 ProQuest database reports
Regular Searches
For collection names or databases that are not part of a collection, you may directly compare C4 “Regular Searches” with C5 “Searches_Regular”. For example, “AFI Catalog”, “Agricultural & Environmental Science Collection”, “ERIC”.
For databases that are part of a collection, you should compare C4 “Regular Searches” with C5 “Searches_Automated”. For example, “Agricola”, “African Newsstream”.
Result Clicks
C4 Result Clicks seem to have no comparable metric in C5. The type of activity measured by Result Clicks is no longer measured in COUNTER 5.
Record Views
C4 Record Views seem to have no directly comparable metric in C5, but one could generate a rough approximation.
The following charts show 2019 usage data for the ProQuest database Agricola using various methods of comparison. Theoretically, one might expect the best matchup would be between C4 Record Views and the difference between Total Item Investigations and Total Item Requests. One could presume that since investigations include requests, if we subtract out the requests we would be left with only investigations — actions that did not involve viewing or downloading a full-content item, which is basically the definition of a Record View. However, this theory did not hold when comparing the actual data. While some months were roughly similar, the values were not consistent enough to be predictable. Each month, total investigations minus total requests varied between 3% to 68% higher than record views. Other combinations were tested, but we found no direct comparable metric between Record Views and any metric or combination of metrics in COUNTER 5.
Best Comparison:
Figure 12: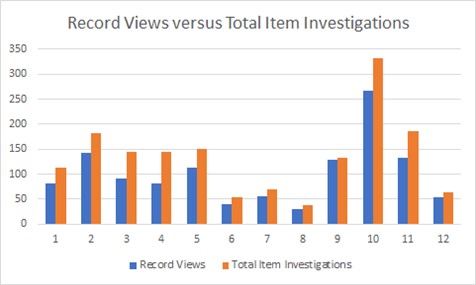
Other Comparisons:
Figure 13:
Figure 14: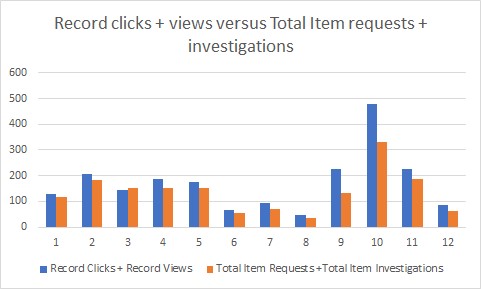
Figure 15: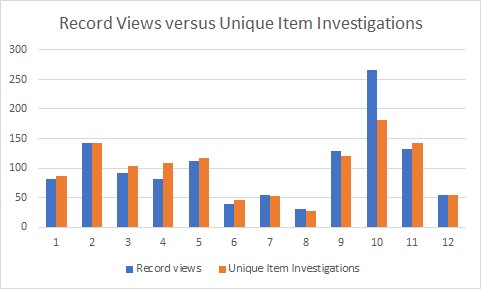
EBSCOhost Database Reports
We tried a direct comparison for search data for a wide variety of Ebsco databases. In Figure 16, you can see a list of Ebsco databases with COUNTER 4 Regular Searches next to COUNTER 5 Searches Regular for February 2019. As you can see, the values are wildly different. For example, Academic Search Complete shows 36,570 Regular Searches in COUNTER 4, but 114,177 Searches Regular in COUNTER 5, a difference of 77,607 — an increase of 212%.
Figure 16:
Unfortunately, none of the other metrics had any better matching results as you can see in Figure 17. We would want the percent change to be consistently 0% in some metric to be able to compare between COUNTER 4 and COUNTER 5, and that just isn’t the case.
Figure 17: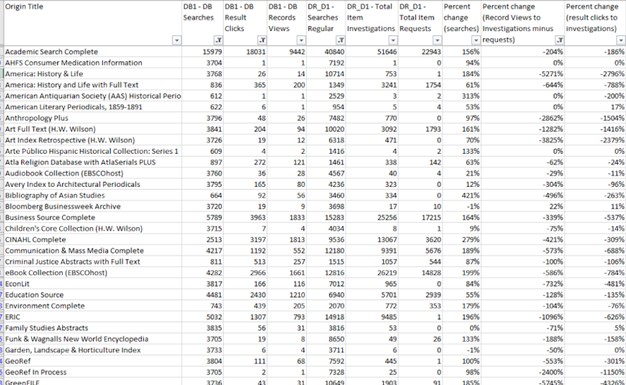
Bibliography
Hendry, John. “RELEASE 5 MANUAL FOR LIBRARIANS Comparing Counts between Release 4 and Release 5 Module 3.” www.projectcounter.org, 2021, https://www.projectcounter.org/wp-content/uploads/2021/03/Counter_Comparing_Counts.pdf. Accessed 18 3 2021.
Hendry, John. “RELEASE 5 MANUAL FOR LIBRARIANS Journals: Understanding metrics and Standard Views Module 2: Journal Usage.” www.projectcounter.org, 2020, https://www.projectcounter.org/wp-content/uploads/2020/08/Module_2_Journal_Usage_20200811.pdf. Accessed 18 3 2021.
Project COUNTER. “Appendix B: Changes from Previous Releases.” Appendix B: Changes from Previous Releases, 2017, https://docs.google.com/document/d/1dCoj8i_eBGCl7l8-ae0y8TsTOFo8hYJK71Kl0TVnF1k/edit?usp=sharing. Accessed 06 04 2021.
Project COUNTER. “COUNTER Release 5 Draft Code of Practice FAQs | Project Counter.” COUNTER Release 5 Draft Code of Practice FAQs, 2021, https://www.projectcounter.org/code-of-practice/counter-release-5-faqs/. Accessed 06 04 2021.